

Observer Analyzer monitors unified communications (UC) deployments, network performance, applications, and troubleshooting on complex networks including VM environments.

Overview
Key Features
Option
Platform Integration
Deployment
Resources
With robust and comprehensive analysis, Observer Analyzer offers immediate issue resolution and builds long-term performance improvements. It provides the complete package needed by network managers, architects, and engineers to achieve peak performance:
- Total visibility into network and application health
- High-level to granular views
- Detailed HTTP tracking for client browser and OS type
- Customized Key Performance Indicators (KPIs)
- In-depth troubleshooting with root-cause analysis
- Application performance analytics
- Expert Analysis alerts you to potential problems and solution strategies
- Over 30 real-time statistics including bandwidth usage, LAN use patterns, and more
How do network teams benefit from Observer Analyzer?
They manage the impact of new application rollouts on the network; validate performance for telepresence initiatives; distinguish network issues from application malfunctions; and apply baseline intelligence for preventive management of critical applications. Analyzer is essential for the following:
- Application performance
- Service assurance
- Network performance
- UC deployment
- Complex VM environments
- Cloud computing
From Apple Talk to VoIP, Analyzer delivers individual packets views and decodes over 740 primary protocols and countless sub-protocols.
Observer Analyzer actually makes you succeed faster.
Application Performance
Reduce downtime and increase productivity with in-depth, contextual application analysis. Get response time data for thousands of applications plus performance metrics,transaction detail, and predictive analytics that show the network impact of new application deployments.
Expert Analysis
Get immediate intelligence in both real time and post capture using Expert Events for TCP, UDP, VoIP, Wireless, and more. It tracks and organizes common services, flags response performance by severity, tracks port-based protocols for slow response, and differentiates between network and application problems with local traffic and WAN/Internet traffic distinction. Enhanced HTTP application monitoring offers deep insight into how web-based applications are operating, as well as how users are accessing IT resources, including browser type and operating system.
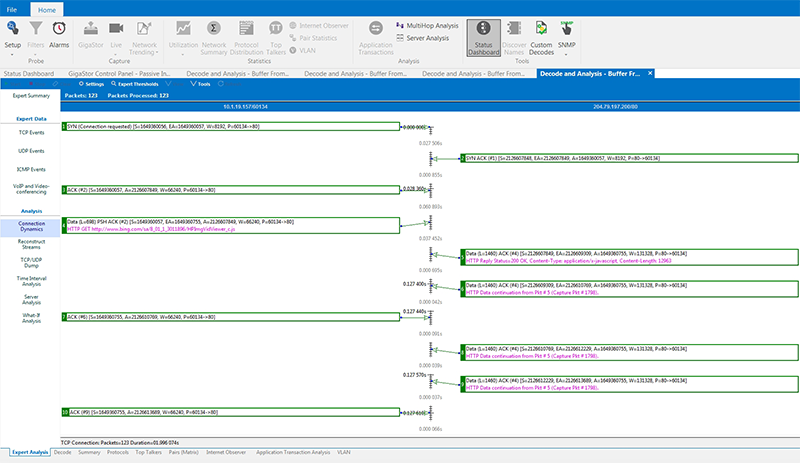
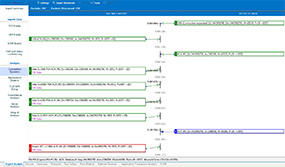
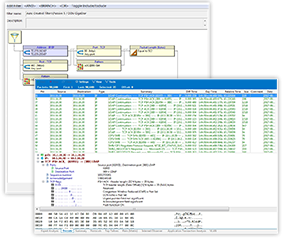
Conversation Analyzer
The only network analyzer that offers Connection Dynamics, it graphically breaks down individual network conversations piece-by-piece, pinpointing which request or response is causing the issue. Retransmissions and dropped packets are flagged for instant recognition of the issue source. Spaces between conversation sections identify latency and response time issues. TCP/UDP Expert Events show excessive retransmissions, and provide an explanation of the problem and possible causes.
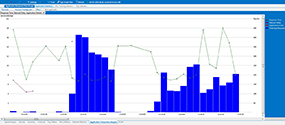
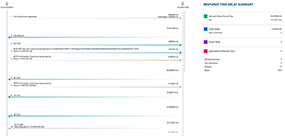
Trending
Use network trending to forecast IT needs or justify upgrades with comparative reports. View and analyze network traffic stats over periods of time — from days to years. Trending metrics can be broadly applied to meet diverse challenges like translating web traffic into Internet usage data to appropriately bill departments on service use.
Troubleshooting
Perform in-depth troubleshooting with an interface that provides intuitive workflows for quick problem resolution. Deep drill-down capabilities with root-cause analysis pinpoint issues at the source with accuracy and ease. High-performance packet capture, decode, and filtering capabilities offer additional support.
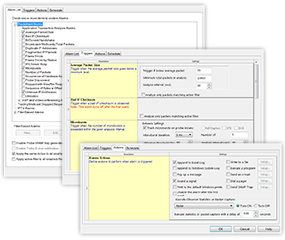
Triggers and Alarms
Analyzer deploys ongoing monitoring of activity levels and immediately sends prioritized alerts when network fluctuations cross your pre-set levels. It gives you the following alert options: emails, paging, trouble tickets, or kick starting an automated packet capture.
Features also include flagging activities or errors from a pre-defined list; setting custom notifications based on any filter; obtaining email with virus information (including source and destination); and placing triggers on any WLAN activity.
Packet Capture
Analyzer's packet capture, decode, and filtering capabilities are second to none. It lets you view individual packets and decode for over 740 primary protocols and countless sub-protocols. Observer filters packets quickly and efficiently by address, address range, protocol offsets, and protocol presets using the intuitive GUI and by-command line.
Observer Analyzer offers three product options based on feature and functionality levels.
Observer Analyzer: Standard Edition
Observer Analyzer Standard Edition offers packet capture, decode, statistics, and more. Solve network issues through root-cause analysis, manage changes proactively through trigger and alarms, apply trending metrics for predictive planning, and more. Get deep and ongoing monitoring.
Features on the Standard Edition include all of the following:
- Real time statistics with Top Talkers, bandwidth utilization, VLAN analysis, Internet activity, wireless analysis, IP Pair statistics, and protocol distribution
- Automated real-time packet capture and decoding with nanosecond resolution
- High-performance 64-bit platform
- Error tracking
- Filters
- Virus and hack signature discovery
- IPv6 Support
- Network trending and reporting with comparison reports, ready-made reports, custom reports, and reports scheduler
- Statistical drilldown
- Triggers and alarms
- Financial protocol support
Observer Analyzer: Expert Edition
Need a network troubleshooter with the speed and muscle complex applications demand? The integrated Expert Edition has every robust feature of Standard Edition with added power to pinpoint problems at the source, and automate the investigation and resolution processes. The Expert Analysis functionality provides the knowledge of 700 Expert Events that alert you to problems, with conversation analysis sections for TCP, UDP, ICMP, Voice and Video Conferencing, and Wireless.
You also get Connection Dynamics for graphical conversation views right up to the application layer. Plus Application Performance Detail that places app issues in the context of its IT environment; and Stream Reconstruction, VoIP tools, and MultiHop Analysis. Use Expert Edition power to keep end-users satisfied and increase uptime.
Features of Expert Edition Include:
- Application trending and analysis for protocols and applications such as: Citrix, DHCP, DNS, FIX, FTP, HTTP, LDAP, MS Exchange, MS Networking (SMB), Oracle®, POP3, SMTP, SQL, Telnet, VoIP, and WebSphere MQ
- End-user experience monitoring
Expert Analysis with over 700 experts, expert summary, network delay, Connection Dynamics, MultiHop analysis, and "What-If" modeling - MPLS monitoring
- NetFlow collector
- SSL decryption
- Stream reconstruction for web pages, emails, instant messages, VoIP, HTTP-transferred files, and video
- Third-party decode and analysis
- Trace file aggregation
- URL-based tracking
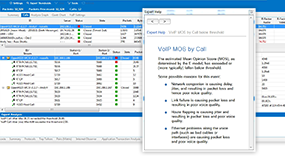
- VoIP Analysis offers: call detail records, aggregate call summaries, over 70 VoIP metrics, over 50 VoIP experts, QoS metrics, MOS, R-factor, and SRTP Support. VoIP Support includes Avaya, Cisco, Mitel, Nortel, Siemens and ShoreTel
Observer Analyzer: Suite
Our premium software console is packed with every feature the Standard Edition and Expert Edition offers, and then some. Suite is a web publishing service, stealth troubleshooter, and complex problem solver – with added bells and whistles to make network managers work smarter, not harder. It provides tools to generate and share customized reports on the web, with optional custom decode modules for proprietary use.
Additional capabilities include:
- RMON support
- SNMP device management
- Switch station locator
- Advanced Web reporting
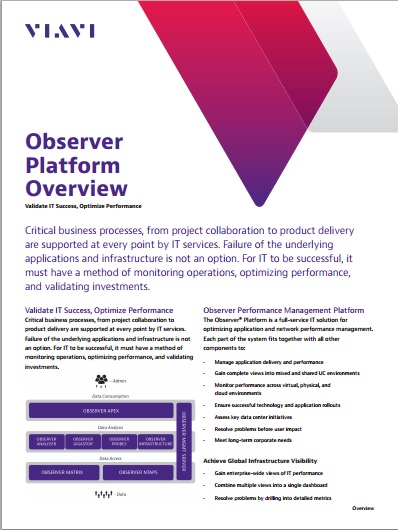
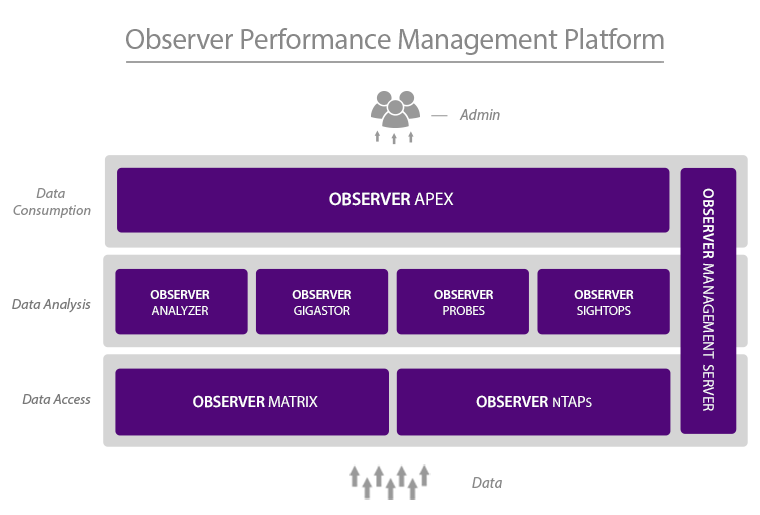
Observer Analyzer is part of the Observer Performance Management Platform where each product seamlessly works together to create IT management solutions for complex environments. It also connects with larger enterprise IT initiatives, including integration with IBM Tivoli and HP OpenView.
Analyzer is often connected with GigaStor, and Apex to increase management performance power.
- Use Analyzer with GigaStor for long-term data capture and in-depth analysis on historical events.
- Analyzer is also used with GigaStor for forensics analysis and stream reconstruction.
- Analyzer pairs with Apex for high-level or aggregate reporting, enterprise-wide reporting, and global alerting.
Observer Analyzer deployment is flexible, intuitive, and problem-free.
The Observer Analyzer software is most frequently deployed on a network engineer’s laptop and used for diverse purposes like connecting to Observer GigaStor and probes; acquiring data via local interfaces like wireless and Gigabit cards; and providing advanced Expert Analysis to packet captures acquired by third party devices. Additionally, some organizations may choose a centrally deployed Analyzer Suite for ongoing trending-data monitoring and analysis or the processing of alarms and alerts.
Observer Analyzer Overview Brochure